

The rise of online businesses takes the number of online stores and sellers to an all-time high. Keeping up with the ecommerce statistics helps understand the intricacies of this quickly developing sphere.
So, it’s no secret that online shopping is on the rise. But what does that mean for your business? If you’re not currently selling products or services online, now is the time to start thinking about how you can tap into this growing market.
We have painstakingly collated the latest and most relevant data regarding ecommerce, giving you the most valuable statistics and figures available.
Let’s dive in.
Top Ecommerce Statistics for 2024 (Editor’s Choice)
- Globally, there are more than 26 million ecommerce sites.
- The average return rate of online shopping is 20.8%.
- 85.9% of Millennials are online shoppers.
- Globally, 25.9% of people buy online.
- In 2021, 72.9% of all online sales came from mobile.
- The world’s biggest ecommerce market is China, with a 52% ecommerce retail share.
- In the US, 69% of adults have shopped online.
- Annually, US ecommerce companies lose $62 billion due to poor customer service.
- In 2021, US online sales reached a record $870 billion in 2021.
- By 2040, 95% of purchases will happen online.
General Statistics for Ecommerce
1. There are over 26 million ecommerce sites worldwide.
(MarkinBlog)
In recent years, ecommerce has become the preferred method of shopping for millions of people, offering a convenient and efficient way to buy goods and services.
With the click of a button, shoppers can find virtually anything they need and have it delivered straight to their door. Not surprisingly, the popularity of ecommerce has resulted in a boom in ecommerce sites.
2. Around 35% of all Google product searches result in a sale within five days, as per ecommerce stats.
(Quibble)
If you’re looking to purchase something online, then your first instinct is probably to go to Google and search for it. So, the statistic above means that if you’re looking to buy something, chances are good that you’ll find it through a Google search.
3. Out of all the available ads, Google Shopping Ads account for 85.3% of all paid clicks, an ecommerce report notes.
(Adwisely)
Shopping ads are excellent tools for ecommerce and have been proven to generate exceptional sales, and with good reason—they’re designed to be highly relevant and targeted so that users are more likely to click on them.
4. Amazon Prime has over 200 million members.
(Yahoo Finance)
With over 200 million members worldwide, Amazon Prime boasts one of the largest online and offline membership services, directly affecting the overall ecommerce statistics by year.
Moreover, between 2019 and 2020 alone, the number of Amazon Prime users grew by 50 million.
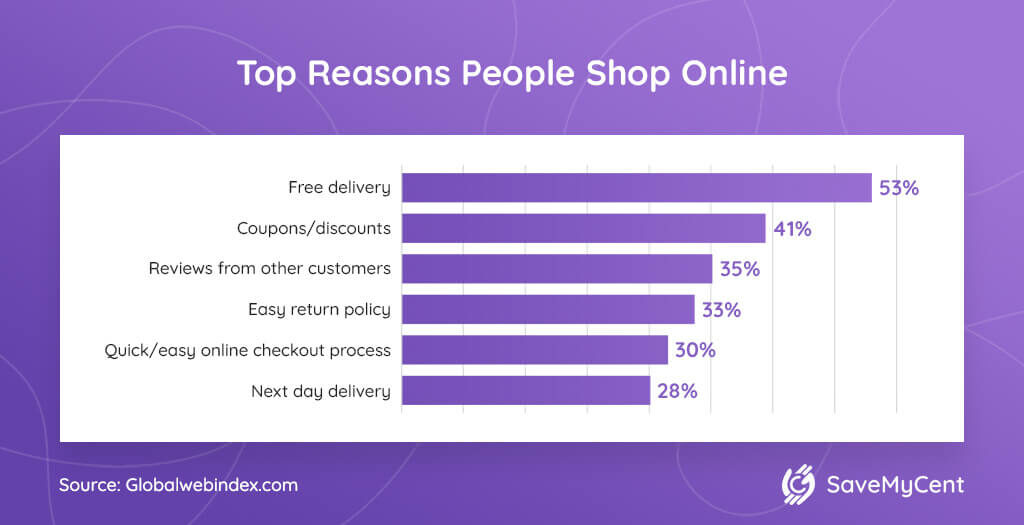
5. 78% of customers say they value free shipping.
(Flexe)
A whopping 90% of consumers would shop online more if shipping was free. Given the high shipping cost, it’s not surprising that free shipping is so important to shoppers.
But speed is also a key concern for many consumers. In fact, 53% of respondents say that fast shipping is vital to them. With the rise of Amazon and other ecommerce giants, consumers expect fast, free shipping.
6. Online shoppers statistics show that 69.8% of online shoppers abandon their carts.
(Big Commerce)
That’s a lot of lost sales revenue for ecommerce stores—an estimated $18 billion annually, as shopping cart abandonment statistics uncover.
Shoppers abandon their carts for many reasons, but some of the most common include high shipping costs, unexpected fees, and complicated checkout processes.
Experts say this rate could be decreased if item descriptions were improved using professional copy instead of second-rate sales pitches. Following ecommerce trends and addressing specific pain points can make a world of difference to any ecommerce business.
7. Almost 60% of online shoppers are not serious buyers.
(CMSWire)
A staggering 58.6% of US online shoppers had abandoned a cart within the last three months prior to taking the survey because they were “just browsing/not ready to buy.”
Although outside of the seller’s control, this rate can be somewhat decreased. Failing to at least try to convince an unsure customer to make a purchase is a foolish mistake, something that online retail sales statistics highlight effectively.
In addition, experts say that improved copy and product presentation could lead to more sales.
8. Sites on cruise and ferry travel services have the highest cart abandonment rate, at 98%.
(Statista)
Given this, it’s evident that cruise and ferry websites are losing potential customers at an alarming rate. Generally speaking, there are a few possible explanations for these worrying ecommerce statistics from 2022.
For instance, booking a cruise or ferry can be a complex process, and customers may abandon their carts if they feel overwhelmed by the choices or the amount of information they need to provide.
Furthermore, many cruise and ferry operators require customers to pay in full at the time of booking, which may discourage customers who are not ready to commit to a purchase.
Also, cruises and ferries are often booked well in advance, so customers may abandon their carts if they are not sure when they will be able to take their trip.
9. The average rate of online returns is 20.8%.
(CNBC)
According to online shopping stats, shoppers return one in every five items they purchase online. There are a number of reasons why this might be the case. The most common reason is that shoppers can’t try on or test products before purchasing.
10. The most common online shopping complaint is longer shipping time, with 46% of respondents citing it as a top issue.
(Kount)
When it comes to online shopping, consumers have a few major complaints. Namely, 42% of consumers say that stores or websites not having items in stock is their primary issue, and 32% have difficulty finding the items they want online.
Ecommerce facts point out that at least 20% of respondents say that more difficulty with customer service requests is their primary complaint about online shopping. These issues can make it difficult for consumers to shop online and force them to seek other options.
11. 85.9% of Millennials buy online.
(Power Reviews)
It’s no secret that Millennials love to shop online. In fact, Millennials make 60% of their purchases online, as ecommerce statistics prove.
Whether they’re buying clothes, cosmetics, or even groceries, Millennials prefer the convenience of shopping from their homes (or their phones).
12. 87% of ecommerce shoppers believe that social media helps them make a shopping decision.
(EBS Farm)
In today’s digital age, it’s no surprise that social media plays a big role in our shopping habits. This is likely because social media platforms provide a wealth of information about products and brands.
For example, Facebook and Instagram allow users to view photos and videos of products, read reviews from other customers, and get an idea of pricing.
13. When buying online, 62% of customers expect an exchange or refund within 30 days of purchase.
(Shopify)
Ecommerce return rate statistics suggest that online shoppers have a more relaxed attitude toward returning online purchases.
Given that customer expectations are high regarding returns, most retailers opt for the refund type that will be the least hassle for both the customer and the business.
This is typically a refund of the purchase price, credited back to the customer’s original payment method. Some businesses offer exchanges or gift cards, but these are less popular options.
14. Despite 90% of online businesses failing within 120 days, ecommerce is still a good option.
(Chris Ducker)
There are several reasons for the ecommerce success rate. First, the barriers to entry are relatively low. Unlike brick-and-mortar businesses, which require a significant upfront investment in inventory and real estate, an online business can be started with just a few hundred dollars.
Second, the reach of an online business is global. With an internet connection, entrepreneurs can tap into markets around the world.
Third, online businesses have the potential to scale quickly. An online business can reach a large audience relatively quickly without incurring high costs with a well-executed marketing strategy.
15. Most Amazon sellers are willing to spend money on ads, with the average seller paying $268.21 daily.
(Influencer Marketing Hub)
This ecommerce trend is popular because ads are an effective way to reach potential customers and increase sales. At the same time, it’s important to create an ad budget that’s realistic and affordable.
If not, you may find yourself quickly burning through your advertising budget without seeing any return on investment.
Fortunately, there are many ways to reduce ad costs, such as using coupon codes or targeting specific keywords.
Global Ecommerce Statistics
16. There are currently more than 2 billion online buyers worldwide.
(Statista)
It’s no secret that online shopping has taken the world by storm. In just a few clicks, buyers can have their desired products delivered right to their doorstep. It’s no wonder that the number of online buyers has been steadily increasing year after year.
17. 25.9% of the world’s population buys online.
(Statista)
There are currently 7.7 billion people in the world. So, the previous statistic translates to 25.9% of the world’s population making purchases on the internet. That’s a huge worldwide market online. So, if you’re not already selling online, these numbers should convince you to do so.
All in all, more businesses are emerging, with more people shopping on the internet, creating a fierce and competitive marketplace.
This makes it harder for online businesses to stand out from competitors, and the need for creative ways to promote your product rises.
18. Global ecommerce sales during the 2021 holiday season exceeded $1 trillion.
(Retail Dive)
To be more specific, worldwide online sales reached $1.14 trillion. In addition, luxury handbags were one of the categories that saw the most considerable growth, with an impressive annual increase of 45%.
19. The world’s biggest ecommerce market is China, with a 52% ecommerce retail share of total retail sales.
(Business)
Ecommerce subsidiaries of the Alibaba group lead this market. Moreover, it’s also one of the fastest-growing ecommerce markets, with an annual growth rate of 21%.
With such a large and rapidly growing market, it’s clear that China presents a huge opportunity for businesses looking to expand into the ecommerce space.
US Ecommerce Stats
20. 53.6% of US households subscribe to Amazon Prime.
(GlobeNewswire)
That can be translated to 66.2 million households. With so many people already on board, it’s clear that Amazon Prime is here to stay. In fact, that number will continue to grow as Amazon expands its reach.
21. Americans under 25 value same-day shipping the most.
(GetShogun)
54% of consumers under the age of 25 value same-day shipping the most. As a matter of fact, that’s one of their main motivators to shop online, leading to an increase in ecommerce purchases.
22. 53% of US online shoppers won’t purchase a product if they don’t know when it will arrive.
(FedEx)
Estimated delivery times are vital in closing sales, according to reports. Retailers must be aware of this trend and ensure they provide estimated delivery times for all their products. Otherwise, they risk missing out on a significant number of potential sales.
23. 68% of US consumers shop more often now with their mobile phones than just two years ago.
(Klarna)
Mobile ecommerce statistics confirm that this is especially true among younger generations, with 79% of Gen Z and 77% of Millennials reporting an increase in mobile shopping.
The study providing these statistics also suggests that the convenience and flexibility of mobile shopping are appealing to consumers who are increasingly looking for ways to save time and money.
24. In North America, the pandemic led to 76% of small businesses becoming more digital in 2020.
(Mastercard)
While B2B ecommerce statistics show that the year has been a whipsaw for B2B businesses everywhere, most business owners agree that one positive side of this pandemic has been the pressure to modernize and digitalize their business.
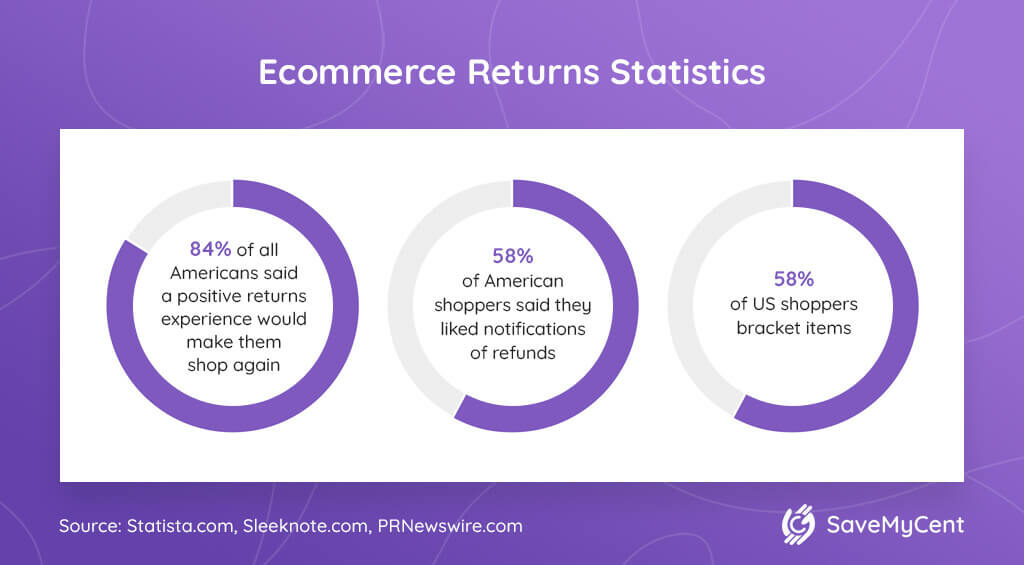
25. Around 58% of US shoppers bracket items.
(Statista)
That’s a decline from the record in 2020 when 62% of customers engaged in bracketing. Bracketing is when a customer purchases multiple variations of the same item and returns those that are not satisfactory.
26. 69% of US adults have shopped online.
(Constant Connect)
So far, 69% of Americans have shopped online, and 25% of Americans shop online at least once a month, according to internet shopping statistics.
The most popular items that are bought online include clothes, books, and electronics. Online shopping is not only convenient, but it’s also often cheaper than shopping at brick-and-mortar stores.
Learn how to save money shopping online.
27. 84% of all Americans say a positive returns experience will make them shop again.
(PR Newswire)
84% of US shoppers report that an efficiently handled returns experience will encourage them to repeat shopping, something Shopify statistics clearly demonstrate. Furthermore, 74% note that US retailers should focus more on improving their return experience.
Ecommerce Trends: Revenue, Share & Sales
28. Amazon is a massive online retailer, with $469.82 billion in net sales revenue in 2021.
(Statista)
Amazon statistics reveal that of this number, somewhere around $127.78 billion in revenue came from international sources. More specifically, North America was the biggest operations segment, bringing in over $279 billion.
If you are a regular on Amazon, you may find our article on how to get free stuff on Amazon useful.
29. Amazon’s share of US ecommerce sales hit an all-time high of 56.7% in 2021.
(PYMNTS)
This means that Amazon now accounts for more than half of all online sales in the US. The company’s dominance is partly due to its aggressive expansion into new product categories and ongoing investment in features like same-day delivery.
30. Adobe’s data shows that Thanksgiving Day online sales reached a record high of $5.1 billion in 2020.
(CNBC)
That was an increased percentage of online sales of nearly 22% from 2019. What’s more, nearly half of all sales came from smartphones, indicating that mobile shopping is becoming increasingly popular.
Moreover, American consumers spent $9 billion on online shopping during Black Friday 2020.
31. In July 2022, Walmart announced a 12% year-over-year increase in US online sales.
(EcommerceBytes)
According to Walmart statistics, total revenue was $152.9 billion. Ecommerce growth statistics indicate an increase in revenue of 8.4%. What’s more, online sales were up by 18% compared to Q2 of 2020.
The company attributed the overall sales growth to strong performance in its grocery business, as well as continued momentum in its ecommerce business.
32. With digital advertising as its primary source of income, Facebook’s revenue was up by 36% in 2021.
(Statista)
Namely, in 2021, Facebook generated $117 billion in advertising revenue, up from $86 billion in 2020. By harnessing the power of data, Facebook has created highly targeted ads that are incredibly effective in reaching consumers.
33. According to ecommerce revenue stats, US ecommerce companies lose a total of $62 billion every year due to poor customer service.
(Understanding Ecommerce)
It’s no secret that bad customer service can cost businesses dearly. In fact, American companies lose a total of $62 billion annually due to poor customer service. That’s a lot of money that could increase profits, expand operations, or improve product quality.
Statistics on Ecommerce: 2020 and 2021
34. More than one-third of 2020 holiday season purchases were made on smartphones.
(WiX)
To be precise, 39% of holiday season purchases were carried out on smartphones in 2020. While computers continue to be the leading devices for online shoppers, mobiles are catching up.
35. In 2021, US ecommerce increased by 14.2%, as ecommerce sales trends note.
(Digital Commerce 360)
The US ecommerce industry has seen significant growth in recent years. According to ecommerce growth data, 2021 was no exception. During the holiday-centric Q4, digital spending grew 9.2% year over year, bringing the total jump in ecommerce for 2021 to 14.2%.
36. In the United States, online sales reached a record $870 billion in 2021.
(Forbes)
That represented a 14.2% increase over 2020 and a 50.5% increase over 2019. In addition, the expansion of same-day delivery and other features is making online shopping more attractive to consumers.
37. Ecommerce statistics show that mobile app orders jumped from 16% to 28% between March and June 2020.
(Stella Rising)
Between March and June 2020, interest in both mobile payments (up from 17% to 30%) and mobile app orders (up from 16% to 28%) surged. All in all, the convenience and safety of mobile payments are simply too great to ignore.
38. 72.9% of all online sales came from mobile in 2021.
(DHL)
2020 has seen an astronomical growth of ecommerce, and in 2021 the rise continued. That is to say, the omnipresence of smartphones and the improvement of mobile payment technology have driven an even larger number of people to shop via their phones.
39. Credit cards accounted for 32% of all online payments in 2020.
(Upgraded Points)
Credit cards have been the leading ecommerce payment method among American consumers for some time now. For comparison, digital wallets accounted for 30.4% of online payments in 2020.
40. In 2020, $102 billion of merchandise purchased online was returned.
(NRF)
Moreover, ecommerce fraud statistics show that $7.7 billion (7.5%) was labeled as fraudulent in 2020. Returns are costly for businesses to process for many reasons. First, the business must bear the cost of shipping the item back to them.
Second, processing a return takes time and labor, which adds to the cost. Finally, returns can often result in damaged or unsellable merchandise, which further reduces the value of the return.
41. COVID-19 ecommerce statistics reveal that 2020 saw a 43% increase in online sales.
(Census)
In other words, between 2019 and 2020, total sales rose from $571.2 billion to $815.4 billion. This trend has continued even after the pandemic’s peak, as more and more people become comfortable shopping online.
For businesses, for instance, this means that now is the time to focus on building an online presence.
Future of Ecommerce Stats
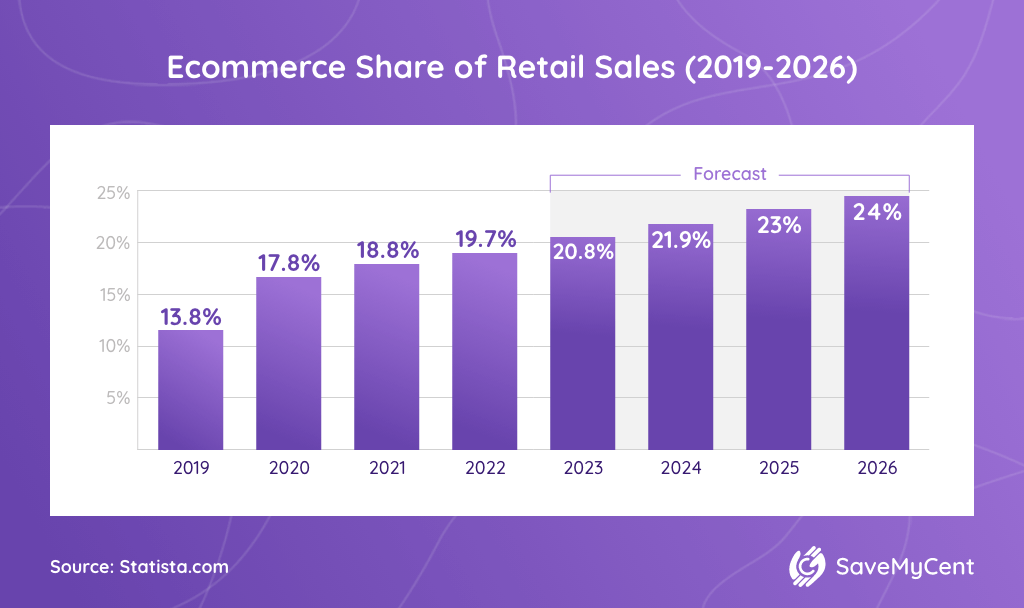
42. Online sales will account for 20.8% of all retail sales by 2023.
(Statista)
It’s estimated that online retail sales will surpass 6 trillion dollars by 2023, with ecommerce websites comprising 20.8% of total retail sales.
This rapid growth is due to numerous factors, including the increasing popularity of online shopping, the proliferation of mobile devices, and the expansion of internet access into developing markets.
43. Global ecommerce statistics show that online retail sales will nearly double by 2023, reaching $6.169 trillion.
(Insider Intelligence)
That’s a significant increase from $3.351 trillion in 2019. Overall, several factors drive this growth, including increasing internet access, rising disposable incomes, and the expansion of online retailers into new markets.
44. The ecommerce market is expected to reach $55.6 trillion by 2027.
(PR Newswire)
Ecommerce stats from 2022 suggest the compound annual growth rate is expected to be around 27.4% during the forecast period from 2022 to 2027. More specifically, rapid urbanization is one of the key factors driving market growth.
45. As per a recent study, the global B2C ecommerce market is expected to reach $8.016 trillion by 2030.
(Yahoo Finance)
This represents a significant increase from the current B2C ecommerce market size and reflects a compound annual growth rate (CAGR) of 8.05% between 2022 and 2030.
However, the market faces some challenges, such as a lack of trust in online transactions and concerns about data privacy.
46. 95% of purchases will happen online by 2040.
(CalBizJournal)
The convenience, selection, and price transparency of ecommerce are simply unmatched by traditional brick-and-mortar stores. Therefore, it’s likely that almost all consumers will soon be doing their shopping from the comfort of their homes.
Ecommerce Statistics: Conclusion
As you can see from the number of ecommerce sites and all the other stats, ecommerce is on the rise and is not only competing with high street retailers but has started to overtake them in sales and profit.
The convenience offered by online shopping, combined with the lower prices made possible due to little to no overhead costs, is increasing online stores and the profit margins they are currently enjoying.
FAQ
What percentage of shopping is done online?
Recent studies show that nearly 20% of all shopping is done online. Moreover, this number will only grow in the coming years.
Who uses ecommerce the most?
Millennials use ecommerce the most. In fact, 85.9% of Millennials buy online. Additionally, they make 60% of their purchases online.
How much does the average person spend online shopping?
The average person in the US spends $3.46 per visit when shopping online. This number can vary depending on many factors, such as what type of goods or services you’re looking for, where you’re shopping, and how much you’re willing to spend.
Will ecommerce continue to grow?
There’s no doubt that ecommerce will continue to grow in popularity. In fact, it’s already one of the most popular ways to shop. The reason? Convenience and choice.
How big is ecommerce?
Ecommerce statistics show that, in 2021, online sales were $870 billion in the US. That was a 14.2% increase compared to 2020 and a 50.5% increase compared to 2019.
Sources:
- Adwisely
- Big Commerce
- Business
- CalBizJournal
- Census
- Chris Ducker
- CMSWire
- CNBC
- CNBC
- Constant Connect
- DHL
- Digital Commerce 360
- EBS Farm
- EcommerceBytes
- FedEx
- Flexe
- Forbes
- GetShogun
- GlobeNewswire
- Influencer Marketing Hub
- Insider Intelligence
- Klarna
- Kount
- MarkinBlog
- Mastercard
- NRF
- Power Reviews
- PR Newswire
- PR Newswire
- PYMNTS
- Quibble
- Retail Dive
- Shopify
- Statista
- Statista
- Statista
- Statista
- Statista
- Statista
- Stella Rising
- Understanding Ecommerce
- Upgraded Points
- WiX
- Yahoo Finance
- Yahoo Finance


![How to Get Free Clothes From Shein? [2024 Guide]](https://savemycent.com/wp-content/uploads/2023/09/How-to-Get-Free-Clothes-From-Shein-336x220.png)