

In this day and age, we can’t imagine our lives without certain apps. It’s no wonder that years ago Apple went with “There’s an app for that” as their slogan. That, however, can be a blessing and a curse.
Convenient as it is, mobile app usage statistics say we’ve become a bit obsessed with mobile applications. Whether you’re looking to lower your screen time or just want to know more about mobile usage app stats in general, this is the place to be.
Must-Know Mobile App Usage Statistics (Editor’s Choice)
- In 2020, there were 218 billion app downloads.
- Tik Tok has been downloaded over 2.6 billion times globally.
- Youtube had the highest reach of all mobile apps in the US in 2021.
- Snapchat had 281 million total downloads in 2020.
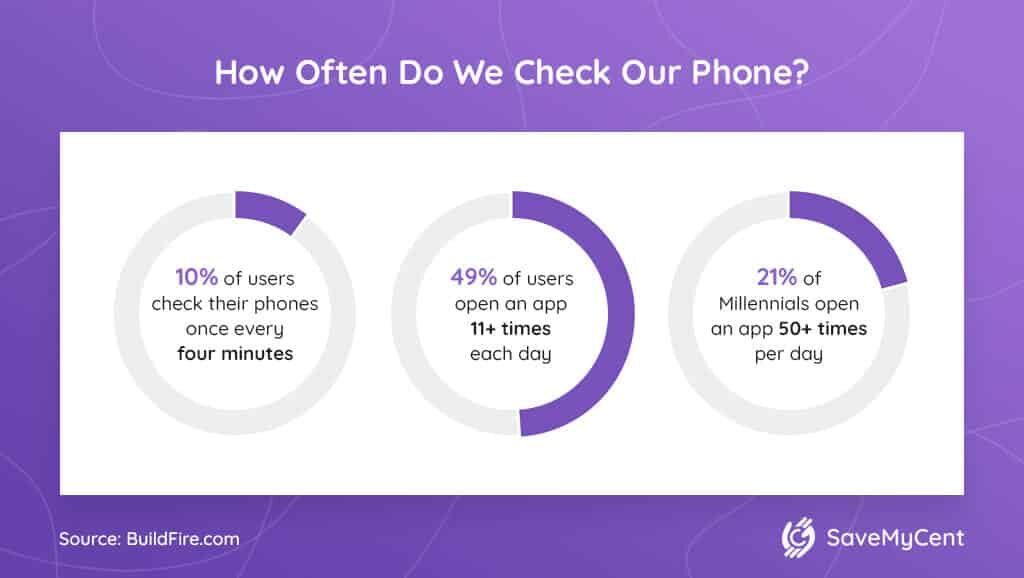
- 21% of Millennials open an app 50+ times per day.
- Nowadays, almost 10% of businesses use more than 200 apps.
- Coin Master, a popular mobile gaming app, generated $117.91 in July 2021.
- In the first quarter of 2021, there were 2.2 million apps in the App store.
Mobile App Download Statistics
1. There were 218 billion app downloads in 2020.
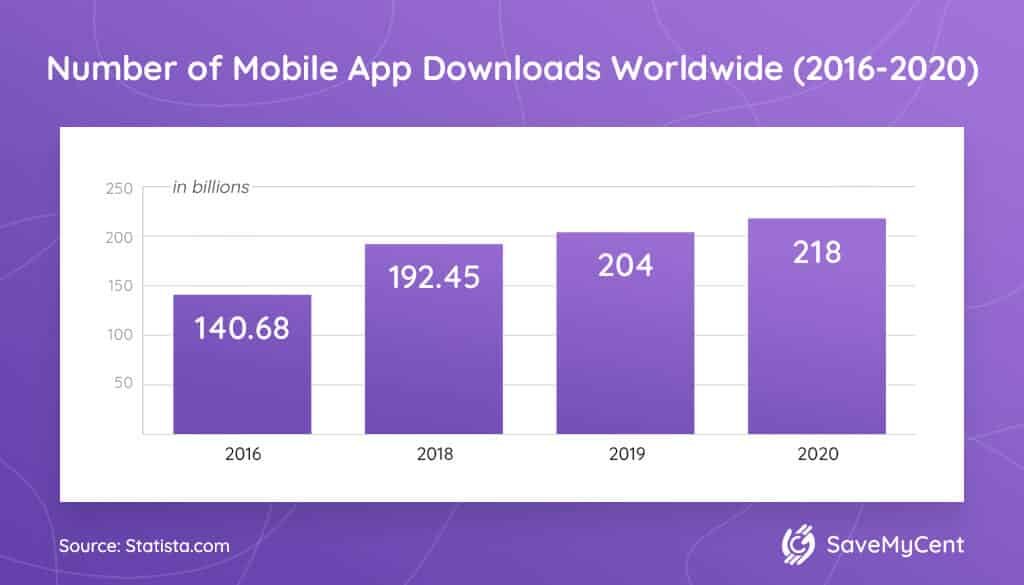
Considering there are around 8 billion people, this number is nothing short of mind-blowing.
On top of that, app downloads statistics show we’re downloading more apps by the year. In 2019, the total number of app downloads was 204 billion, which is 11.5 billion more than in 2018.
2. Tik Tok has been downloaded over 2.6 billion times so far.
(Wallaroo)
In the first quarter of 2020, Tik Tok had a tremendous 315 million downloads. At the beginning of 2021, in January, Tik Tok was downloaded 62 million times. Furthermore, Tik Tok statistics show that this app has over 1 billion monthly users.
3. Facebook-owned apps have 16 billion downloads combined.
(Omnicore)
Do you know anyone who doesn’t own at least one of Facebook’s apps? According to apps download statistics, applications like Facebook, Facebook Messenger, and WhatsApp have been killing it in the last decade.
Facebook alone has 4.6 billion downloads over the last ten years. Considering that it’s available in 101 languages, with 300,000 people making translation possible, it’s easy to understand how it got such a high app adoption rate.
4. According to the latest data, Snapchat had 281 million total downloads in 2020.
(Omnicore)
The mobile app download and usage statistics show Snapchat isn’t close to catching up with Facebook. However, the app isn’t doing all that bad, either.
Created in 2011, Snapchat caters to the younger audience, and it does it so well. Mobile app usage stats show that more than 5 billion snaps are created every day.
5. In June 2020, Twitter topped its record for the number of daily installs with 677,000 worldwide downloads.
(TechCrunch)
Mobile app usage statistics for 2020 show Twitter is getting bigger, and it’s no surprise. With the pandemic going on, the app’s growth rate was expected to skyrocket.
For anyone who wants to know what’s going on in the world, there’s no better social media platform than Twitter. You can choose who to follow and what to see. Moreover, all the news is bite-sized due to the character limit.
According to apps stats, most installs in June 2020 came from the UK, India, and Mexico. However, the social media platform did very well in the US as well. With 140,000 daily installs, Twitter almost broke its US record.
6. In 2020, the single most downloaded game app in the US was Among Us.
(Statista)
By far, the most popular mobile applications currently are gaming apps, and among those, Google Play Games takes the lead. According to mobile app usage stats, the number of its downloads reached 55 million.
7. There are over 2 billion WhatsApp users worldwide, and the number is rising.
(Oberlo)
When we say the number of users is rising, we mean it. Back in 2016, the total number of this app’s downloads was at 1 billion. In 2018, the number of users jumped to 1.5 billion.
There’s a clear trend in this mobile app’s growth. Every two years, WhatsApp gets half a billion new users. And the app isn’t just sitting idly on users’ phones, either. Out of the current 2 billion users, as many as 1.6 billion access WhatsApp every month.
8. Facebook Messenger has more than 2 million monthly downloads in the US.
(CM.com)
On top of that, Messenger has over 2 billion users worldwide.
Though this messaging app is a great way to reach friends and stay in touch, it’s not the only reason people use it. Plenty of businesses are using the perks of Messenger ads, and it’s no wonder. App statistics show that Messenger marketing has an 80% better open rate than what you’d see in email marketing.
Chatbots have become quite popular as well. There are currently 300,000 bots on this messaging app.
9. Nowadays, almost 10% of businesses use more than 200 apps.
(The Wall Street Journal)
By the end of 2018, businesses were using an average of 129 apps. That means the average number of apps businesses are using is growing steadily. In just four years, that number has jumped 68%.
When it comes to the most popular among those apps, enterprise mobile apps statistics put Microsoft’s Office 365 at number one. The popularity of Office 365 is a long-standing one — it’s held this title ever since 2015.
10. Youtube has the highest reach of all mobile apps in the US in 2021.
(Statista)
If you think that the most used mobile apps in 2021 are Facebook-owned ones, you are wrong. Youtube is used by 77% of mobile users in 2021. The second most used app is Facebook, and third place took Google Maps, reaching 57%.
App Revenue Statistics
11. In July 2021, Coin Master generated revenue of $117.91 million.
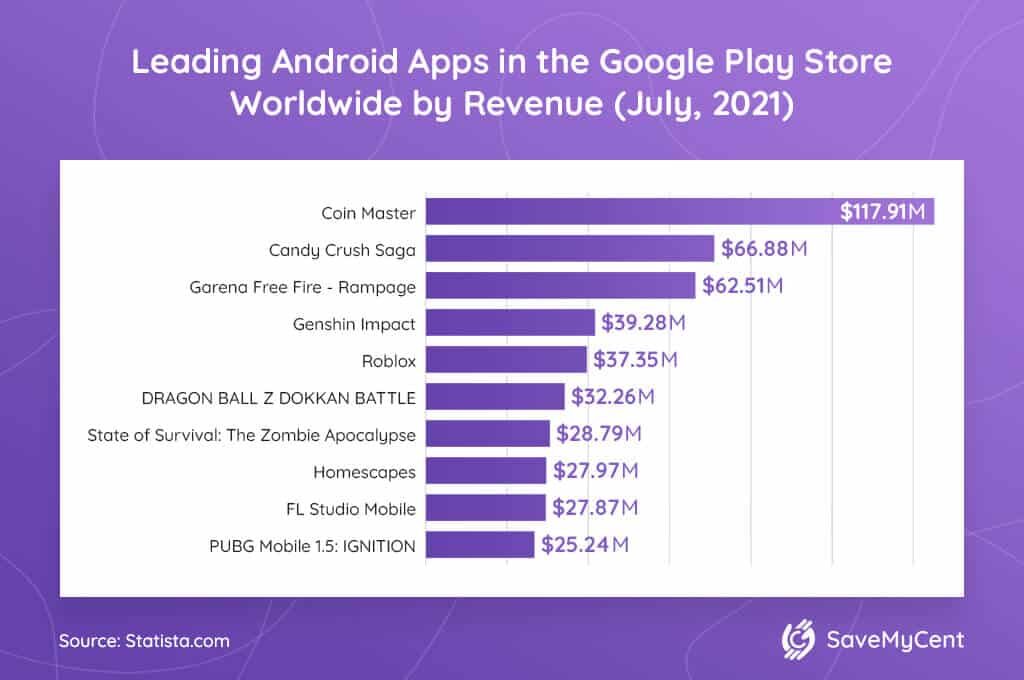
The app market statistics place Coin Master as one of the most popular mobile gaming apps worldwide. Candy Crush Saga was the second most popular individual game with a generated revenue of $66.88 million, right before Garena Free Fire – Rampage with $62.51 million.
Smartphone apps statistics show that in 2020 users have spent more than $1 billion total on Candy Crush Saga. The craziest part? Those were all in-game purchases since the game itself is free to play.
12. App store consumer spending is projected to increase to $157 billion worldwide by 2022.
(Clearbridge Mobile)
According to iOS app statistics, as of June 2020, the App Store’s average app price is $0.97, and the average game price is even lower — $0.51. With such low prices, it’s no wonder mobile app sales statistics show users are ready to start spending more money.
When it comes to iPhone users, iPhone app usage stats for 2019 show the average user spent $100 in the App Store, and this number is likely to keep growing.
Regardless, the projected $157 billion in consumer spending is a huge jump. Mobile app usage statistics for 2017 tell us that we would witness a 92% increase in just five years.
13. In the first half of 2020, consumers spent a combined $50.1 billion worldwide on the App Store and Google Play Store.
(SensorTower)
According to statistics for mobile apps, the highest-earning non-game app in the first half of 2020 was Tinder. Its user spending did fall from $532 million to $433 million year-over-year due to COVID-19, but it’s somewhat surprising that the app hasn’t been hit even harder.
Mobile app industry statistics show the second highest-earning non-game app in 2020 so far has been YouTube. Users spent an estimated $431 million worldwide on this app.
14. In 2020, the global mobile application market’s value was placed at $581.9 billion.
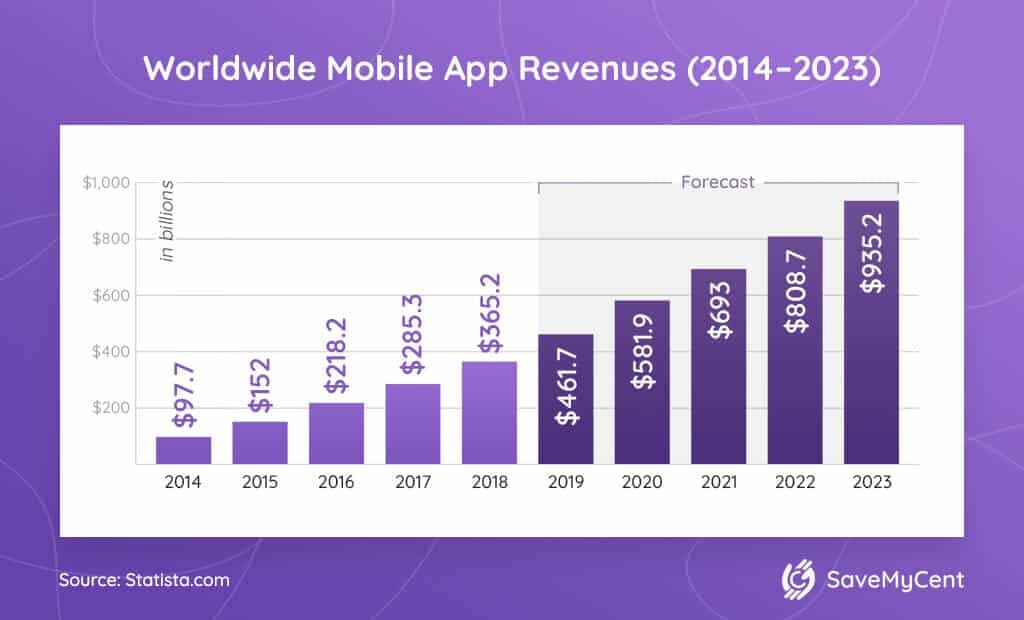
In 2021, it’s expected to reach $693 billion.
Since 2018, the gaming segment has been dominating the app market. The list of apps by their market value positions Google Play Games at number one, while Tinder is the highest-earning non-gaming app.
According to app industry statistics, giants like Apple Inc., Google LLC, and Hewlett Packard Enterprise are the key players on the market.
By 2026, the global mobile application market’s CAGR is projected to grow by 18.4%.
App Store Statistics
15. As of the 1st quarter of 2021, there were more than 2.2 million total apps in the App store.
(Statista)
Compared to roughly 3.48 million apps on Google Play Store, it doesn’t sound like much. However, uploading an app on the App Store is a lot harder than uploading it on Google Play Store. Due to a less thorough process of approval, you’re more likely to find a low-quality app on Android than on iOS.
According to App Store download statistics, one of the most popular apps in 2020 was TikTok.
16. App download statistics for 2020 show that 108.5 billion app downloads came from Google Play Store.
(Statista)
Mobile application statistics show that in Q3 2020, for example, Google Play Store had more than 28.9 billion downloads — while iOS apps had only around 8 million downloads.
If you didn’t know the number of apps in both App Store and Google Play Store, these iOS app stats would have you believe Apple isn’t doing that well. However, since the Google Play Store has a million more apps than the App Store, these mobile app download stats aren’t that surprising.
17. According to Apple App store statistics, 706 new apps appear in the App Store every day.
(42Matters)
That means publishers release around 5,000 new apps every week. According to mobile app statistics, there are currently over 1.3 million app publishers on the App store.
Statistics about mobile app usage place Games, Business, and Education as the most popular app categories.
Mobile App Habits
18. Tools have a 99% penetration rate among Android users.
(BuildFire)
App download statistics for Android show that users are hugely dependent on Tools. Apps such as Find my Device or Google Assistant have become an essential part of our lives, so it’s no wonder their penetration rate is almost 100%.
When it comes to Android, mobile app usage numbers show one more app category with a 99% penetration rate — Communication.
19. 10% of users check their phones once every four minutes.
(BuildFire)
As we mentioned, we can’t imagine our lives without certain apps. And this is how serious it’s gotten — the average American tends to check their phone every 12 minutes.
Mobile app user statistics disclose another worrying number. Almost half of the users (49%) open an app more than 11 times a day. It’s no wonder then that mobile apps contribute to 57% of all digital media usage.
20. 21% of Millennials open an app 50+ times per day.
(BuildFire)
And we thought opening an app 11+ times was a lot!
According to mobile app demographics, Millennials are especially reliant on their apps. But they’re not alone. On average, a smartphone user tends to spend 2 hours and 15 minutes a day using various apps.
Given that there are 60 to 90 apps on an average user’s phone, it would be hard not to spend more than two hours on them.
21. 45% of Americans have tried digital health products, like fitness trackers or mobile health apps.
(MarketingCharts)
App download data shows almost half of Americans are willing to improve their health through digital products or apps. According to health app usage statistics, a quarter of adults under 55 are likely to be using these apps.
On the other hand, those who perhaps need them the most are not that likely to give health apps a go. Statistics about mobile apps show that only 12% of users aged 55 and above are likely to use health apps.
22. In the US, smartphones are responsible for 96% of all digital map uses.
(BuildFire)
When we talk about mobile app usage statistics, most of us automatically think of apps like Facebook or Tinder. However, we use essential apps, such as maps or weather, far more than we’re aware of. For example, smartphone apps are responsible for 86% of all digital weather content consumption.
Facts about mobile apps show that just a handful of apps are enough to make our lives easier. We mostly use Amazon for purchases, Gmail and Facebook for communication, Maps for navigation, and YouTube for video content.
Wrap-Up
Years ago, Apple came up with its famous “There’s an app for that” slogan. Nowadays, that’s exactly how it is. Whether you want to check the weather, read the latest news, or contact a family member, you’ll likely just pick up your phone to do it.
With 8.93 million apps out there, it would be hard not to find one for what you need. Among those 8.93 million apps, gaming and Facebook-owned apps are the most popular phone applications.
The one downside of apps is the amount of time we tend to spend using them. Mobile app usage statistics show some worrying trends in that aspect. Luckily, there’s a way to track (and control) just how much time you spend on different mobile applications.
It’s undeniable that apps make our lives easier if we use them in moderation. Stay responsible, use your time wisely, and enjoy everything the world of apps has to offer!
FAQ
Q: How do I find app usage statistics?
Both iOS and Android give you the option to access your mobile phone app usage statistics.
Apple has a Screen Time feature to help you track the time you spend on apps. To see your iPhone app usage statistics, simply go to the Settings menu. The same applies to iPadOS. On macOS, you’ll find the stats in System Preferences. The great thing is that once you find them, you can see your application usage statistics across all Apple devices.
If you have an Android, you can find the Digital Wellbeing option in Settings. You’ll see a chart of Android app usage, showing you which apps take up most of your time.
Q: How many mobile apps are downloaded each day?
According to apps downloads statistics, the number of daily app downloads in 2020 should be around 592 million. It means the number of average app downloads per month is likely to top 17 billion.
When you know that the number of apps added to the App store every day is 706, these apps statistics stop being as surprising. Plus, now that many people avoid going out, there’s not much to do but find new and useful apps to pass the time and stay safe.
Q: How many apps does the average person have in 2021?
The answer to this question isn’t straightforward. Apps download statistics show that an average smartphone has between 60 and 90 apps. However, an average person uses only 25 apps a month. What’s more, 90% of the overall time they spend on smartphone apps is split between only ten different apps.
Q: How often do people use apps?
The answer mobile app users statistics provide is — very often. Let’s start by saying that 90% of all time people spend on phones is spent on different apps. Gone are the days of talking to someone for hours via regular phone calls.
While 49% of people open an app 11+ times a day, Millennials have taken it to a whole new level. According to app usage statistics, more than a fifth of Millennials open an app an astounding 50+ times a day.
Q: How many mobile apps are there?
Overall, there are more than 8.93 million mobile apps out there. How many apps does Apple have? The answer is — around 2.2 million. Google Store, on the other hand, currently offers around 3.48 million apps.
The majority of all mobile apps come from the Chinese market. In fact, the most substantial increase in the number of mobile apps last year came from app stores such as ApkGK, APKPure, and Android Apps APK.
China’s mobile market currently accounts for 40% of the overall app spending. If you haven’t heard of these app stores before, you’re bound to be hearing about them a lot more.
Q: What age group uses apps the most?
In general, young adults use mobile apps most often. While 21% of Millennials access apps 50+ times a day, older adults in the US (aged 35-54) only access mobile apps 7.7 times a day. Since app usage data shows the national average is 8.3 times a day, it’s clear that Millennials use mobile apps the most.
Another interesting statistic is that, on average, 18-24 year olds spend 66% of their digital media time using smartphone apps. If you were ever wondering what the mobile app vs. mobile website statistics would say, there’s your answer. It’s clear that smartphone apps dominate the overall time spent on digital media, especially for young adults.
Q: Which apps have the most users?
When we’re talking about the most used mobile applications in general, social and entertainment apps are winning. In the US, Youtube is used by 77% of the population in 2021.
As for mobile apps owned by one company, Facebook’s applications are by far the most used. So far, according to mobile app usage statistics, Facebook-owned apps have had 16 billion downloads combined.
Resources:


![How to Get Free Clothes From Shein? [2024 Guide]](https://savemycent.com/wp-content/uploads/2023/09/How-to-Get-Free-Clothes-From-Shein-336x220.png)