
In 2022, more and more shoppers are opting for online instead of traditional shopping, as statistics on online shopping vs. in-store shopping show.
Here’s why.
For starters, convenience is synonymous with online shopping, and it’s probably its biggest perk. As a consumer, you can shop anywhere, day or night.
There’s more.
Online shops’ prices are often lower. Also, if you’re one of those people who hate it when shop assistants hover over your shoulder as you shop, online shopping might be an excellent option for you.
What’s in it for the sellers? It’s simple—sales volume.
Still not convinced? Here are some stats to help you make an informed decision.
Surprising Statistics on Online Shopping vs. In-Store Shopping (Editor’s Choice)
- Before making a major purchase, 81% of consumers go online.
- More than 2.14 billion people worldwide bought goods and services online in 2021.
- Six in ten Canadian shoppers prefer online shopping to physical stores.
- Almost 85% of US Millennial internet users have made a purchase via a digital channel.
- In 2020, 30% of brands said that opening physical stores was still a priority for them.
- In 2021, brick-and-mortar sales grew faster than e-commerce sales for the first time.
- 53% of sales happen via smartphones.
- 68% of shoppers have used mobile devices in a physical store for product information.
Surprising Online Shopping vs. In-Store Shopping Statistics & Facts
1. According to a recent study, 81% of consumers go online before making a purchase.
(Sales Lion)
Furthermore, they spend an average of 79 days gathering information. This research is often conducted through various means, including reading product reviews, visiting manufacturer websites, and searching for deals and discounts.
With so much information available at their fingertips, it’s no wonder consumers educate themselves before making a purchase.
2. In 2020, online spending surged by $900 billion compared to the prior two-year trend.
(CNBC)
These online shopping vs. in-store shopping statistics from 2020 showing that e-commerce took off in 2020 come as no surprise since consumers were forced to stay home due to the pandemic.
In fact, nearly every retailer’s online sales saw a jump, thanks to shoppers being stuck at home. All in all, for many people, the pandemic has been a time of upheaval and uncertainty. However, there has been one silver lining: the rise of online shopping.
3. 69% of Americans have purchased something online.
(Fram)
So, nearly 70% of people in the US have bought something online so far. This figure represents a dramatic increase from the early days of e-commerce when the outcome of the brick-and-mortar vs. online battle was clear-cut. It looks like Americans are no longer afraid to use their credit cards online.
4. E-commerce vs. retail data show that retail chains ended 2020 with a collective 76.8% growth in e-commerce.
(Business Edition)
2020 saw e-commerce soaring to new heights. Although some industries, such as apparel, took a devastating hit last year, they are expected to see a massive improvement on the digital front.
According to online shopping statistics, the upcoming years are likely to be even more successful.
Global Statistics on Online Shopping vs. In-Store Shopping
5. In 2021, digital wallets accounted for 49% of the global e-commerce transaction value.
(Fis)
This is significantly more than credit cards, which are in second place at 21%, credit card stats reveal. Believe it or not, digital wallets are projected to have a 53% share by 2025.
The growing popularity of digital wallets is due to their numerous advantages over traditional payment methods. They are more convenient, secure, and efficient and offer users different perks, such as loyalty programs and rewards.
6. Online vs. in-store shopping data note that, in 2021, over 2.14 billion people worldwide bought goods and services online.
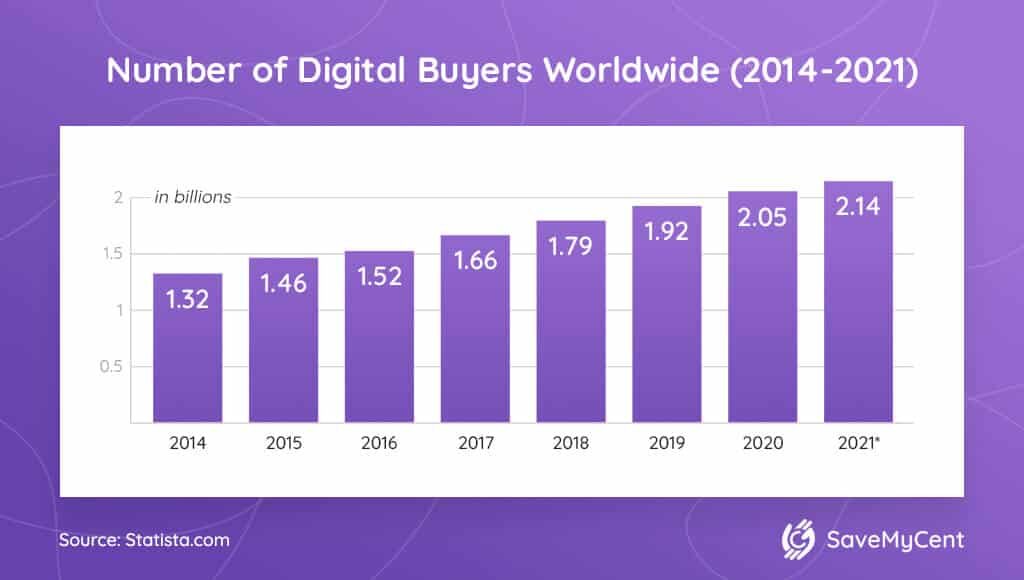
That number was only 1.66 billion in 2016.
E-commerce is growing fast, and many sellers are switching to online sales platforms to meet growing demands. The number of online shoppers is likely to go even higher in the coming years.
7. With 46.3% of retail sales being online, China remains the biggest e-commerce market in 2022.
(Insider Intelligence)
E-commerce vs. brick-and-mortar statistics from 2022 show that the UK and South Korea are also seeing strong e-commerce growth, with online sales accounting for 36.3% and 32.2% of total retail sales, respectively.
These numbers highlight the growing importance of e-commerce as a sales channel worldwide, and businesses must adjust their strategies accordingly if they want to stay competitive.
8. By 2026, global retail e-commerce sales are forecast to amount to $8.1 trillion.
(Statista)
Online sales vs. retail sales data show that it would represent an increase of nearly 56% from 2021. Moreover, a significant portion of this growth can be attributed to the increasing popularity of mobile commerce.
9. According to a recent survey, 60% of Canadian shoppers prefer online shopping to physical stores.
(Canadians Internet)
Furthermore, 65% said they shop online to avoid crowds. Canadians are especially likely to shop online during the holidays, with 64% expecting to spend part of their holiday budget online.
Brick-and-mortar vs. e-commerce spending data show that, on average, surveyed Canadians expected to spend somewhere around $892 online during the holiday season.
The holiday season is a busy time for everyone, and shoppers are no exception. With so many things to do and people to see, it’s no wonder that more and more people are choosing to do their holiday shopping online.
10. Online shopping vs. in-store shopping stats confirm that in 2020, 2.05 billion people globally bought goods online.
(ZigZag Global)
So, now you know how many people shopped online in 2020 and 2021. With the convenience of purchasing items from the comfort of your own home and having them delivered directly to your door, it is no wonder that the number of people shopping online has grown exponentially.
11. The brick-and-mortar retailer market value was expected to drop to $4.711 trillion in 2020.
(Insider Intelligence)
As the pandemic gave an unexpected boost to all things digital, brick-and-mortar retailers suffered a considerable loss last year.
While losses are still calculated, the bottom line is hard to miss: brick-and-mortar retailers will have to evolve to survive.
Retail vs. E-Commerce by Demographics
12. The percentage of male online shoppers in the EU is slightly higher than that of females—74% and 73%, respectively.
(Eurostat)
This difference is relatively small, but it is noteworthy nonetheless. So, the study found that, in general, internet users in the European Union are quite active when it comes to online shopping.
13. A recent report showed that 48% of African American households shopped online in 2020.
(PR Newswire)
This was approximately 11% more than the average household. Data on online shopping vs. brick-and-mortar confirm that African American consumers are increasingly turning to digital channels for their shopping needs.
14. Nearly 85% of US Millennial internet users have made a purchase via a digital channel.
(Statista)
They are also more likely than other generations to purchase products via social media and try new retail technologies like visual search or voice commerce through smart speakers.
As the first generation to grow up with access to the internet, it’s no surprise that Millennials are active online shoppers, as many online shopping vs. in-store shopping statistics from 2022 show.
15. The pandemic has spurred a shift to online shopping, with 63% of Hispanics saying they prefer to shop online.
(HN Magazine)
It goes without saying that the coronavirus pandemic has profoundly impacted how people shop, and that is especially true for Hispanics. Before the pandemic, around 53% of Hispanic respondents preferred shopping in stores, while approximately 47% chose online shopping.
Online Sales Growth vs. Brick-and-Mortar
16. The global e-commerce market is growing rapidly and is forecast to reach $7.5 trillion by 2025.
(Asendia)
E-commerce growth statistics show a 50% increase from 2021, when retail e-commerce sales amounted to approximately $4.9 trillion worldwide.
As more consumers turn to the internet for their shopping needs, businesses are increasingly investing in e-commerce platforms.
17. The total market share for online sales will rise to 23.4% in 2023.
(CBRE)
The rise of e-commerce has been one of the biggest trends in the retail industry in recent years.
In fact, it shows no sign of slowing down. According to recent estimates and online shopping statistics by year, e-commerce’s share of retail sales is forecast to increase from 20.7% in 2021 to 23.4% in 2023.
This growth is driven by many factors, including the increasing popularity of online shopping, the proliferation of mobile devices, and the growing availability of high-speed internet.
18. 30% of brands say that opening physical stores was still a priority in 2020.
(Vend)
While the pandemic forced many brands to reconsider their plans, it appears that the desire to open new stores remained strong.
The reasons for this are different, but one explanation is that brands believe having a physical presence helps build customer loyalty and trust.
19. The percentage of retail sales online saw a significant increase from 2019 to 2020.
(The Balance Money)
In 2019, Q4 e-commerce sales amounted to $156.39 billion. Then again, just one year later, in 2020, Q4 e-commerce sales rose to $206.66 billion.
20. In 2021, brick-and-mortar sales grew faster (18.5% rate) than e-commerce sales (14.2% rate) for the first time.
(CeoWorld Magazine)
The pandemic has accelerated the shift from offline to online shopping, but the data show that consumers are now returning to physical stores. This is likely due to various factors, including the COVID-19 vaccine rollout, improved economic conditions, and pent-up demand.
Online Shopping vs. In-Store Shopping Statistics, Sorted by Device Type
21. 53% of sales happen via smartphone devices.
(The Drum)
These m-commerce statistics result from the increasing number of consumers using their phones to research and purchase products. In addition, businesses are increasingly investing in mobile-friendly websites and apps that make it easy for customers to buy from their phones.
22. Smartphones are the most popular choice for product browsing, with 52% of consumers using them for this purpose.
(Cross Border Magazine)
Laptops are the second most popular choice, used by 23% of respondents. This is likely because smartphones are more convenient than laptops and can be used anywhere at any time.
The study and its statistics on a physical store vs. online store also found that people spend more time browsing for products online than in stores, with 53% of respondents spending more than 15 minutes browsing in a single session.
This compares to just 38% of people who spend the same time browsing in shops.
23. 11% of consumers use desktop computers to browse products online.
(Cross Border Magazine)
There are a few reasons for this relative popularity. However, the most common one is that desktops tend to have larger screens than laptops and mobile devices, making it easier to view product details and images.
24. In 2021, 71% of Black Friday/Cyber Monday (BFCM) purchases were made from mobile devices.
(Shopify)
In comparison, online shopping vs. in-store shopping research and its Black Friday/Cyber Monday statistics note that 29% of BFCM purchases were made on desktops.
Black Friday stats confirm that more people are choosing to shop from the comfort of their homes.
This is especially true when it comes to Cyber Monday when people can take advantage of even greater savings by shopping online, data on brick-and-mortar stores vs. online stores point out.
25. 68% of shoppers have used a mobile device inside a physical store to browse for product information.
(Klarna)
Have you ever been to a store, seen an item you liked, and wondered if other stores have better deals? Is the only problem that you don’t want to go to different stores to compare prices?
That’s why 68% of shoppers use mobile devices to compare items they find in stores. These shoppers also check a product’s review before making a purchase, as online review facts show.
Online Shopping Affecting Retail Stores Statistics
26. In 2021, 57% of US shoppers planned to shop online during the holiday season, as opposed to 43% who planned to go to stores.
(Statista)
These holiday shopping statistics note that online shopping is simply more convenient. You can shop from the comfort of your own home, and there’s no need to battle crowds or fight for parking. Plus, you can often find better deals online.
So if you’re looking to save time and money this holiday season, consider doing your holiday shopping online.
27. Shopping online vs. shopping in stores stats show that 56% of consumers prefer shopping online because they can shop at any time.
(Statista)
The ability to shop 24/7 seems appealing to online shoppers, as online customer behavior stats show. Physical shops only stay open for a certain amount of time, making it impossible for people to shop 24/7.
Besides being able to shop at any time of day, sometimes potential clients aren’t always in the same country as the sellers. Luckily online shopping knows no geographic boundaries, and clients can shop from any country.
28. E-commerce vs. brick-and-mortar data show that 40% of clients prefer to shop online because it saves time.
(TechPrevue)
Shopping at a physical store takes time. You need to get dressed, travel to a particular store, pick items there, queue to pay for them, and travel back home. Shopping online can literally take just a few seconds, and that’s why it’s getting popular among consumers.
Conclusion
One of the most attractive qualities of online shopping is the ability to shop without stepping foot in a store and not worry about delivery logistics.
The shopping online vs. in-store statistics above show that online shopping is growing faster than brick-and-mortar, and entrepreneurs should take note.
So, retailers need to focus on creating a great shopping experience in their stores while making it easy for customers to buy online.
People Also Ask
Is online shopping more popular than in-store shopping?
While online shopping has flourished in recent years, it appears that brick-and-mortar stores are making a comeback. In 2021, physical store sales grew faster than e-commerce sales for the first time.
Is online shopping cheaper than in-store?
Typically, online shopping is cheaper than in-store. This is because online shops don’t have the same overhead costs as brick-and-mortar stores. For example, they don’t have to pay for rent, staff, or inventory.
How does online shopping affect retail stores?
There are a few ways that online shopping affects retail stores. Two of the most crucial ones are:
- People shop online to find better deals, so retailers have to offer lower prices to compete with online shops, which can lead to lower profits for the stores.
- Many people now prefer to shop online because it’s more convenient than going to a store, meaning retail stores are losing customers to the internet, which can also lead to lower profits.
How much shopping is done online?
Statistics on online shopping vs. in-store shopping reveal that e-commerce sales in Q1 of 2022 accounted for 13.9% of total sales. More shopping is done online because people are comfortable making purchases online.
Sources:
- Asendia
- Business Edition
- Canadians Internet
- CBRE
- CeoWorld Magazine
- CNBC
- Cross Border Magazine
- E-commerce Germany
- Eurostat
- Fis
- Fram
- HN Magazine
- Insider Intelligence
- Insider Intelligence
- Klarna
- PR Newswire
- Sales Lion
- Shopify
- Statista
- Statista
- Statista
- Statista
- TechPrevue
- The Balance Money
- The Drum
- Vend
- ZigZag Global


![How to Get Free Clothes From Shein? [2024 Guide]](https://savemycent.com/wp-content/uploads/2023/09/How-to-Get-Free-Clothes-From-Shein-336x220.png)