

The retail industry is constantly changing, and with the rise of m-commerce, it’s more important than ever to stay up-to-date on the latest statistics. In this article, we’ll take a look at some of the most recent m-commerce statistics and trends.
Generally speaking, businesses need to ensure that their websites are optimized for mobile devices if they want to capitalize on this growing trend.
So, whether you’re a retailer looking to expand into m-commerce or just interested in how this form of commerce is growing, you will find these stats helpful. Without further ado, read on and learn more.
M-Commerce Statistics 2024 (Editor’s Pick)
- 69.4% of internet users use shopping apps on their mobile devices.
- 73% of Australian consumers use mobile devices to buy and pay for items online.
- 96% of Chinese consumers use their smartphones to shop online.
- Shoppers spent more than 100 billion hours on shopping apps in 2021.
- Fashion retailers convert almost 90% of mobile traffic into sales.
- Three-quarters of online shopping cart abandonment happens on mobile.
- In Japan, the mobile commerce market is worth around 4.9 trillion Japanese yen.
- US consumers spent nearly 3 billion hours using mobile-shopping apps in 2021.
General M-Commerce Statistics
1. 69.4% of internet users use shopping apps on their mobiles.
(Byteout)
This is a significant increase from just a few years ago.
The rise in mobile shopping is due to many factors, including the increasing availability of high-speed internet connections, the improving quality of mobile devices, and the growing number of people who are comfortable making transactions on their phones.
In addition, many retailers have made it easier to shop on mobile via mobile-friendly websites and apps.
2. M-commerce trends show that fashion retailers convert 89.3% of mobile traffic into sales.
(The Drum)
Among fashion retail sites, mobile traffic eclipsed desktop traffic in 2014. SInce then, the gap between them has only widened.
With more and more consumers using their smartphones and tablets to shop for clothes, it’s crucial for retailers to have a strong mobile presence—those who don’t risk being left behind in the ever-changing world of fashion.
3. In the travel industry, only 29% of sales are completed on mobile.
(The Drum)
Travel-interested businesses such as aviation companies and hoteliers are struggling to replicate fashion retailers’ enviable mobile commerce statistics.
While smartphones supply more than half of travel site traffic, mobile users often have to switch to personal computers since more complex purchases are usually harder to accomplish on small screens.
4. 75% of online shopping cart abandonment happens on mobile.
(Namogoo)
If you’re selling online, it’s important to know that many of your potential customers may abandon their carts before completing their purchase. In fact, on average, 69% of online carts are abandoned before the checkout process is completed.
The rate of m-commerce shopping cart abandonment is high. There are many reasons why this may happen, but some common ones include unexpected fees, high shipping costs, or complicated checkout processes.
5. In 2021, the Amazon app had more than 98 million monthly users.
(Statista)
Although other top retailers were miles away from matching Amazon’s number in this department, Jeff Bezos’s company didn’t dominate all m-commerce statistics.
Interestingly, shoppers spent the most time on the Walmart app compared to other retailers, with an average of more than 120 million visits per month. eBay dropped to the 11th position, registering 3.67 million monthly visits in 2021.
6. Approximately 53% of sales happen via smartphone devices.
(The Drum)
The fashion industry enjoys somewhat better mobile shopping statistics. For instance, retailers in the field attract more traffic and have 67% of sales coming from mobile devices.
7. In 2021, there were 1.75 million merchants on Shopify.
(Shopify News)
In recent years, Shopify has seen significant growth due to the increasing popularity of e-commerce. With more consumers shopping online than ever before, businesses are turning to Shopify to create their own digital storefronts.
As of June 2021, the Canadian multinational raked in more than $2 billion in revenue.
Worldwide Mobile Commerce Statistics
8. Smartphones are the most popular shopping device among British online shoppers, at 65%.
(Statista)
In the United Kingdom, ownership of smartphones is nearly universal among 16–34-year-olds, and it’s expected that m-commerce will surpass around $112 billion in sales by 2024.
In general, the rise of m-commerce has been driven by the increasing prevalence of smartphones and the popularity of apps and mobile-friendly websites.
9. According to recent data, 44.6% of internet users in Malaysia and South Korea purchase online via mobile phones weekly.
(Statista)
M-commerce stats show this is significantly higher than the worldwide average of 30.6%. In comparison, only 5.5% of surveyed Ghanaian internet users said they had purchased something online via their mobile phone in the past week.
10. 73% of Australian consumers use mobile devices to purchase and pay for items online.
(Clear Sale)
This is a significant increase from previous years, and it seems that mobile shopping is here to stay.
Mobile commerce trends indicate that around 55% of mobile shoppers purchase or pay for things using their mobile devices at least once a week, and the average Australian consumer spends $235 per month using mobile devices.
Namely, e-commerce stats imply that about 33% of online sales in Australia are now done through mobile devices, making it one of the most popular platforms for online shopping.
11. 54% of e-commerce in the Czech Republic is done via mobile phone.
(J.P. Morgan)
The Chech Republic has the fastest growing e-commerce market in Europe, and its high mobile payments e-commerce stats are the catalysts for its emergence. However, cash is still king in this Central European country.
12. In China, 96% of consumers use their smartphones to shop online.
(SCMP)
With such a high percentage of people shopping via mobile, Chinese e-commerce platforms constantly evolve to offer new experiences and engage consumers.
By offering cutting-edge features, Chinese m-commerce platforms are able to stay ahead of the curve and keep consumers coming back for more.
13. The mobile commerce market in Japan is now worth around 4.9 trillion Japanese yen.
(Statista)
The mobile commerce market is booming. In fact, it more than doubled over the last decade. Most Japanese consumers own a smartphone, and many use it for online shopping, as online shopping stats show.
Japanese businesses have quickly capitalized on this trend, offering mobile-friendly websites and apps that make it easy to browse and buy products on the go.
14. The South Korean mobile shopping transaction value totaled 37 trillion South Korean won in Q1 of 2022.
(Statista)
Mobile commerce statistics from 2022 show an increase from the 31.36 trillion won in the first quarter of 2021. More specifically, food services lead the categories at around 5.63 trillion South Korean won.
These trends indicate that South Korea is becoming increasingly digitized, with consumers turning to mobile devices to make purchases.
15. 43% of consumers in India prefer to use mobile phones for shopping.
(Entrepreneur)
M-commerce statistics by country reveal that, on average, Indian consumers spend INR 10,000 per month on purchases made via mobile devices. Moreover, as many as 83% of consumers make an online purchase via mobile phone at least once a week.
16. A recent survey of consumers in the Middle East showed that 47% frequently use their smartphones for purchases.
(PWC)
This significantly increased from 31% who shopped via mobile phone daily or weekly in 2020, as mobile shopping statistics for 2020 note.
The outbreak of COVID-19 has led to a shift in consumer behavior, with more people turning to digital channels for their shopping needs.
This is especially true in Egypt, where 72% of consumers have gone digital since October 2020.
17. The mobile economy of Sub-Saharan Africa is projected to have 615 million unique subscribers by 2025.
(Further Africa)
Nigeria and South Africa will see the highest smartphone penetration rates.
Since formal banking and credit card usage aren’t popular in the region, the rapid development and adoption of e-wallets are some of the emerging trends in m-commerce to watch out for.
18. In 2021, online retail sales made through mobile devices in Latin America were estimated at $64 billion.
(Statista)
That translates to an almost 35% growth compared to the previous year. This growth is primarily due to the increasing number of people who own mobile devices and have access to the internet.
By 2025, m-commerce sales in the region are forecast to reach $107 billion. M-commerce offers many advantages over traditional e-commerce, including the ability to make purchases anywhere at any time.
19. Mobile commerce stats show that in 2021, at least $170 billion was spent in app stores worldwide.
(Business Standard)
This number becomes even more impressive compared to the previous year. Statistics show that in 2021, total app store spending on Google Play, third-party Android in China, and iOS grew by 19%.
20. In 2021, shoppers spent more than 100 billion hours in shopping apps, as per statistics on mobile phones and e-commerce.
(Internet Retailing)
That was an 18% increase from the previous year. Shopping apps have become increasingly popular recently, as consumers look for convenient ways to shop from their mobile devices.
More specifically, fast fashion, social shopping, and big brands have been among the most popular types of apps, driving strong growth in the mobile commerce market.
In fact, social commerce statistics note that social commerce could become the norm sooner than expected.
Indonesia, Singapore, and Brazil have been among the fastest-growing markets for mobile shopping, with respective growth rates of 52%, 48%, and 45%.
US Mobile Shopping Statistics
21. Consumers in the United States spent nearly 3 billion hours using mobile-shopping apps in 2021.
(Digital Transactions)
This proliferation is due to these apps’ convenience and ease of use. With a few taps on a smartphone, consumers can compare prices, read reviews, and make purchases without ever having to leave their homes.
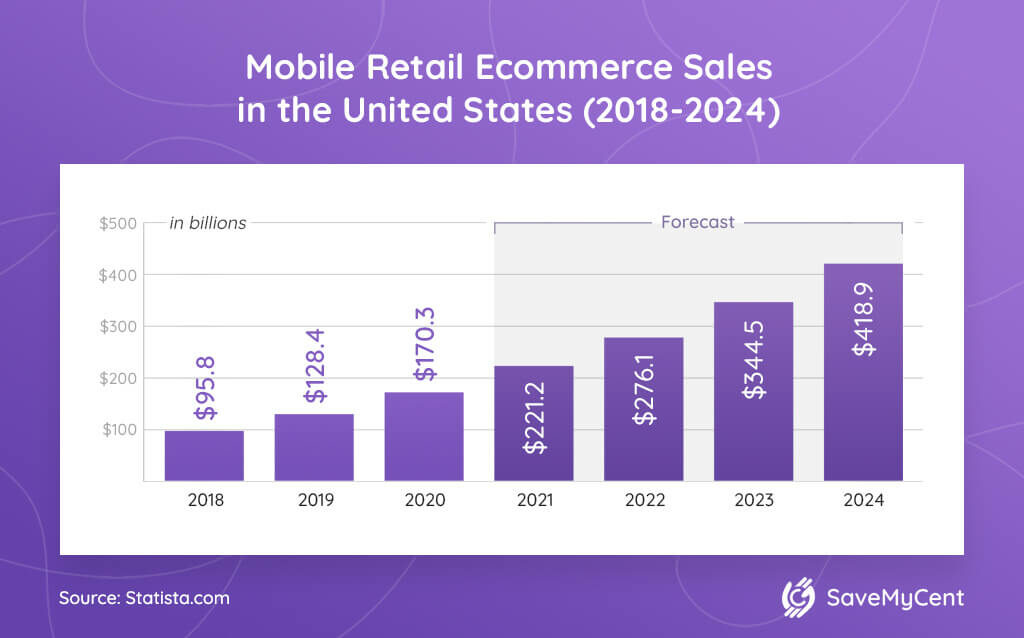
22. The US mobile commerce is projected to hit $418.9 billion in sales by 2024, as per mobile e-commerce stats.
(Syte)
Mobile commerce has been overgrowing in recent years, driven by the increasing number of consumers who own smartphones and tablets. In addition, the rising popularity of smartwatch devices is also expected to contribute to the growth of mobile commerce.
23. By 2024, 187.5 million Americans will have purchased through a web browser or mobile app on their mobile device.
(Statista)
Mobile commerce statistics from 2020 reveal that this is up from just over 167 million in 2020, representing a significant increase from the beginning of the decade when mobile buyers first started to become a substantial portion of the population.
That’s a huge market, and it’s one that businesses can’t afford to ignore. Mobile commerce will only become more important in the coming years, so companies need to ensure they are prepared to meet the needs of their mobile customers.
24. Mobile shopping trends suggest that, with 41 million downloads, Amazon was the top US shopping app in 2020.
(Retail Dive)
So, Amazon statistics indicate a successful 2020 year for the app.
Moreover, Walmart stats show that Walmart followed Amazon with 34 million downloads, and Wish took third place in leading shopping apps in 2020, with 30 million downloads. eBay, Shein, Target, Wayfair, and Nike were other dominant shopping apps that year.
M-Commerce Growth Statistics
25. By 2024, the volume of m-commerce transactions is predicted to soar at a CAGR of 25.5%.
(CogentHub)
The volume of m-commerce transactions will increase significantly in the next two years. The US m-commerce volume has enough momentum to balloon from just $128.4 billion in 2019 to $488 billion in 2024.
26. US retail m-commerce sales will nearly double their share of total retail sales between 2020 and 2025.
(Daze Info)
Mobile commerce growth stats uncover that in 2021 alone, retail m-commerce sales in the US grew by an impressive 15.2%, thanks to the growing popularity of m-commerce.
Additionally, this trend will continue as more and more shoppers discover the benefits of mobile shopping.
27. Mobile commerce sales will exceed $430 billion by the end of 2022 and $710 billion by 2025.
(Neklo)
More and more businesses are investing in mobile-optimized websites and apps that make it easy for customers to purchase products and services on the go. As a result of these trends, it’s clear that mobile commerce is here to stay.
Conclusion
Most of the mobile commerce statistics above show how smartphones have become integral to the average consumer’s online activity. However, the evolution of 21st-century shopping won’t stop once all digital buyers become mobile users.
But, by looking at how many people shop online, we can conclude that we won’t shop via smartphone exclusively—at least not in the foreseeable future. Mobile commerce is just a cog (a vital one) in the wheel called unified commerce.
FAQ
What is mobile commerce?
Mobile commerce, also known as m-commerce, refers to buying and selling goods and services through mobile devices such as smartphones and tablets.
Many merchants are now offering mobile versions of their websites, allowing customers to browse and buy products from anywhere at any time.
What percentage of e-commerce is mobile?
Around 53% of e-commerce sales happen on smartphones. In fact, this number will only increase in years to come as more and more people shift their shopping habits to mobile devices.
How many people shop on a mobile device?
Around 60% of internet users shop on mobile. In addition, many retailers are creating responsive websites so that shoppers can buy products no matter what device they are using.
What percent of online retailers have m-commerce websites?
According to the latest data, 75% of online retailers have mobile commerce websites. So, retailers that don’t have mobile commerce websites are missing out on a big opportunity.
What is the value of m-commerce?
The value of m-commerce is evident in its convenience and accessibility. With m-commerce, buyers can purchase items anytime, anywhere.
Additionally, there is a growing trend of users making larger purchases on mobile devices, so the value of m-commerce will likely increase in years to come.
When did mobile device sales surpass personal computer sales?
Since 2010, smartphone sales have surpassed PC sales. This is a huge shift, as PC sales have been declining for years while smartphone sales continue to grow at a high rate.
What is the future of m-commerce?
The future of m-commerce is looking very bright. Namely, mobile commerce will hit $418.9 billion in sales in just a few years. Moreover, by 2024, it’s expected that 187.5 million Americans will have purchased via a mobile app or web browser.
M-commerce will also have a significant impact on total retail sales. By 2025, mobile commerce sales are expected to exceed $710 billion.
M-commerce statistics indicate that this would nearly double the mobile commerce share of total retail sales between 2020 and 2025.
Sources:


![How to Get Free Clothes From Shein? [2024 Guide]](https://savemycent.com/wp-content/uploads/2023/09/How-to-Get-Free-Clothes-From-Shein-336x220.png)