

As consumer spending makes up 70% of GDP in the US, it’s obvious that Americans love shopping. Spending habits always entail a certain pattern that repeats among different groups of consumers but is also contextual. It tells us more about what consumers want and what they’re accustomed to.
In our review of the latest American spending habits statistics, we’re bringing you some eye-opening information. Let’s dig in to learn more about how both individuals and households spend their money, their changing habits during the pandemic, and what millennials spend their money on.
Top Consumer Spending Statistics (Editor’s Choice)
- Spending on housing makes up 23% of the yearly spending of an average American.
- Food is 18% cheaper than it was 75 years ago.
- An American household will, on average, invest or save 27% of its income.
- 20% of the highest-income households spend a bit more than half of their yearly income.
- The black households’ spending grows at a 2% higher rate than the white households’ spending.
- During the pandemic in 2020, Americans saved $1.6 trillion more than in 2019.
- Millennials are the highest-spending population in the US, and 74% of them plan their spending carefully.
The Most Essential American Spending Habits Statistics
1. On average, an American citizen spends $61,334 per year.
(Oberlo, CNBC)
This translates to approximately $5,111 per month. Moreover, average American spending per year has seen a constant increase since 2017. From 2017 to 2020, spending increased by 2.1%.
However, it’s interesting to note that personal income increased a lot faster. In the same period, income rates increased by 14.7% (the annual growth of 4.7%). This might be explained by the fact that more and more citizens choose to invest surplus income.
2. The average cost of living in the US is $61,334.

The average cost of living is best indicated by the average annual expenditure a single consumer makes. Currently, this figure is higher than ever. The cost of living in the US has increased significantly in the last 20 years, and the only signs of decline were observed during the recession years of 2008 and 2009.
3. Consumer spending makes up 68.8% of the entire US economy.
(FRED)
Overall, consumer spending habits resulted in $1.45 trillion spent in 2020. Over the years, the figure hasn’t changed. In the second quarter of 2021, consumer spending made up 69% of the economy.
4. American consumers spend the most money on housing—34.9%.
(Oberlo)
With $21,409 spent on average, Americans’ biggest expenditure is on housing. The next category is transportation with $9,826, followed by food ($7,316) and personal insurance and pension ($7,246).
5. The median apartment rental rate in the US has almost doubled since 2000.
(Statista, Experian)
In 2020, the median rent for an unfurnished apartment was only $841. Since 2018, this figure has reached $1,588. Regarding rental rates by the state, it’s clear that a higher average income means a higher rent price. For example, residents of West Virginia usually pay $866 for rent, while those in California are most likely to pay $2,542.
6. An average household spending on food is $7,316.
(Statista)
Annual expenditure on food has been steadily increasing in the last 20 years. In 2000, an average household spent $5,158, which makes the current expenditure higher by 29.4%.
7. 75 years ago, Americans spent more money on food than they did on housing.
(Visual Capitalist)
Visual Capitalist analyzed US consumers’ spending habits in the last 75 years and came up with interesting findings. Food spending has gone through some changes. Historical American consumerism statistics reveal that Americans spent approximately $8,311 per year on food, compared to the current $6,759.
The reason behind it is not that food was cheaper (it’s cheaper today, as you can see), but other sectors of spending increased significantly, especially housing, transportation, and healthcare.
Consumer Spending Statistics Regarding Household Expenses
8. An average American household spends 73% of its total income.

An average American household has 2.5 people and $73,574 of total income. Its members spend $53,708 and save $9,898. Majority of spending relates to housing ($11,896), utilities ($2,480) and vehicles ($4,054). An average household spends the least of its income on gifts and charity—$1,873 per year.
9. The bottom 20% of households spend all their income.
(Visual Capitalist)
Spending habits by income reveal that a household located in the bottom 20% has a yearly income of $25,525. Salary is only a small portion of it—$3,663. These households rely on income from Social Security ($5,871) and income from loans and previous savings ($13,590). Figures show that these households also spend the most on housing, utilities, and vehicles.
10. The highest 20% of households spend only 53% of their income.
(Visual Capitalist)
The spending habits of Americans coming from higher-earning households are different from lower-income households’ spending and saving habits. Logically, the less money you have, the less money you’ll manage to save. The top 20% of the highest earners save almost half of their income while spending on housing, vehicles, gas, insurance, and entertainment.
11. Black households account for less than 10% of the total national spending.
(McKinsey)
Although representing 13.4% of the US population, Black households are significantly underrepresented in total national spending on goods and services. Moreover, African American spending habits show that Black households earn less income and have smaller spending power. That’s why many companies avoid investing in marketing aimed at Black consumers.
However, according to experts from McKinsey, they might be overlooking a chance to generate an additional $300 billion in yearly revenue with the right strategy of approaching Black households.
12. Black households have a 2% stronger growth rate in spending than White households.
(McKinsey)
American spending habits statistics by race suggest that Black households generate $835 billion in total consumer expenditures per year. This also entails expenditures for loans and debt maintenance as Black individuals are 50% more likely to have a student or medical debt. However, when looking into growth rates for the past two decades, Black households have had an annual growth rate in expenditures of 5%.
White households have kept their growth rate of 3% steady, but the rate has been mostly driven by population growth and not the increase in actual spending.
American Spending Habits Statistics During the 2020 Pandemic
13. In 2020, Americans spent 41.91% more money on investments than in 2019.
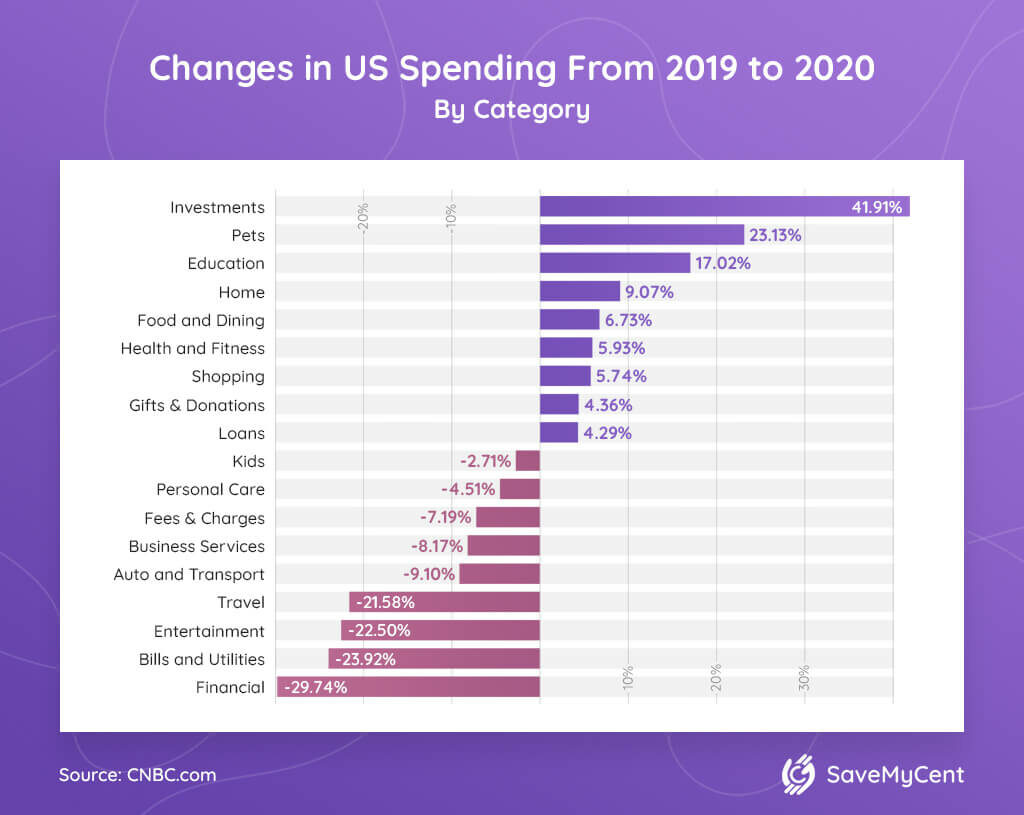
Mint, a personal finance manager app, shared its data on user spending habits to reveal how the 2020 pandemic influenced their financial behavior compared to 2019. The largest increase in spending happened with investments (41.91%), pet care (23.13%), and education (17.02%).
On the other hand, the customer spending behavior in 2020 revealed that Americans spent 29.74% less on financial services (advisors, life insurance, and similar), 23.92% on bills and utilities, and 22.5% on entertainment.
14. In 2020, consumers saved $1.6 trillion more than they usually would.
(Deloitte, Bureau of Economic Analysis)
With spending being restricted, many consumers in America managed to save significantly more money than they usually do. Along with increased spending on home improvements and investments, saving habits have also resulted in positive figures.
Moreover, American spending habits from 2021 suggest that savings in the first two quarters reflect a similar dynamic. This is encouraging news for industries. Experts note that higher savings will likely contribute to quick market recovery as the pandemic slows down.
15. Pandemic spending habits show that spending on alcohol was down by 17.4% in 2020.
(BLS)
As working hours of restaurants and bars were limited in 2020, spending on alcohol also decreased. The Bureau of Labor distinguishes between expenditures for alcohol outside the home and at home. The pandemic affected the spending outside the home as it dropped by 43.9%. Surprisingly, alcohol spending at home increased by only 4.5%.
16. Spending on food dropped by 10.4% in 2020.
(BLS)
Similar to alcohol, the food industry has also been affected by the changes in American spending habits during 2020. In total, food spending decreased by 10.4%, but the decrease was especially notable with away-from-home spending on food that was down by 32.6%.
The highest drop was observed with households of three members—37.3%. On the other hand, food-at-home spending was up by 6.4%.
17. Spending on reading was up by 23.9% in 2020.
(BLS)
American spending stats show that, as consumers had to curtail their outdoor activities due to lockdowns and restrictions, stay-at-home activities were on the rise. So, it’s not so surprising that spending on reading was almost a quarter higher compared to 2019. Data on average time spent reading supports this figure—people older than 15 spent 4 more minutes per day reading than in 2019.
18. Entertainment spending was down by 5.8% in 2020.
(BLS)
American spending habits during the pandemic show that spending on entertainment slightly dropped in 2020.
Overall, this figure is a result of two major changes. Fees and admissions (movie and concert tickets mostly) were down by an incredible 51.7%, while spending on entertainment supplies, equipment, and services was up by 48.8%. These figures show that entertainment is an important aspect of consumers’ daily lives as they quickly found a stay-at-home substitute for live events.
Once movies and concerts are completely back in our lives, check out for options to get free tickets for the theaters.
19. 58% of Americans spend their stimulus check on bills.
(PR Newswire)
US consumer spending statistics for 2020 reveal that 67% of consumers received their stimulus check to help them with covering the unexpected costs of losing a job, higher rent, and so on. Moreover, out of those who had received a check, 34% spent it on groceries, while 29% put it into savings.
20. Spending on services is still lower by 4.7% than before the pandemic.
(Deloitte)
While American spending statistics show that spending on goods during the pandemic survived the economic hit relatively easily, the service industry wasn’t that lucky. However, as the pandemic is slowing down thanks to vaccination rates and fewer restrictions, the industry is recovering.
For example, there was finally a 19.3% increase in spending on services in April 2021. However, it’ll take a while before spending figures return to those before February 2020.
21. 60% of Americans say that the pandemic radically changed their budgeting and spending habits.
(PR Newswire)
American spending habits during the pandemic show that pandemic conditions put financial decisions and habits to the test. More than half of Americans have seriously reconsidered how to spend their money. Two out of five Americans report they had serious financial setbacks during 2020, which made 75% of them reevaluate their long-term budgets.
22. Digital spending will increase by 15–30% due to the pandemic.
(McKinsey)
Although online shopping rates had increased even before the pandemic, many consumers who hadn’t been shopping online changed their habits during several lockdowns.
American consumption facts show that online shopping increased in all purchasing categories, with OTC medicine (44%), groceries (41%), household supplies (38%), and personal care products (38%) in the lead. In the aftermath of this increase, online shopping will grow up to 30% compared to pre-pandemic rates.
Millennials’ Spending Habits and Habits of Other Demographic Groups
23. Millennials are the population spending the most in the US.
(The Fulfillment Lab)
Millennials make up the largest share of the US population (more than $72 million). With about $600 billion spent each year, they’re the backbone of the US economy.
However, the marketing focus is slowly shifting towards Gen Z, as they currently spend about $140 billion annually. The majority of this population still haven’t finished their education, but they’ll soon have significant spending power.
24. On average, millennials earn between $64,000 and $75,000 annually.
(GAO, BLS)
Data on consumer spending demographics tells us more about the spending habits of millennials. Out of the total earned income, they spend approximately $47,256, meaning that the rest of the income probably goes to savings or paying off debts.
The fact they’re the highest-spending population in the US doesn’t mean they’re carefree. On the contrary, research from the US Government Accountability Office states that millennials are overwhelmed by financial insecurity and anxious about their economic future.
25. 74% of millennials actively budget their money.
(Deloitte, Money Habitudes)
Millennials’ spending habits show that most millennials stay on top of their spending habits. Even more so, 64% report they’ve set clear financial goals for the future, and 72% feel they have enough knowledge to make informed financial decisions.
Moreover, millennials understand that the definition of spending habits means repeating a certain pattern, and being aware of that pattern can help them budget their money more wisely.
26. With 38%, millennials are the most prevalent generation among new home buyers in the US.
(National Association of Realtors, Deloitte)
Moreover, 13% of them are younger millennials and 25% are older millennials. However, Deloitte’s survey shows that 25% of millennials are unable to pay all the bills each month, and 54% of them couldn’t deal financially with higher unexpected costs. Getting some tips on saving money on food and electricity could improve economic stability.
27. College students spend up to $53,949 to cover tuition, housing, and other personal expenses.
(Education Data Initiative, ThinkImpact)
College student spending habits show that college students pay $37,200 to cover tuition for a private non-profit college. However, other personal expenses can significantly increase students’ yearly costs. On average, students will spend an additional $16,749 on housing, course materials, food, entertainment, and other personal expenses. However, this figure can go up to $21,073 for students studying at four-year for-profit colleges.
28. College student spending has nearly doubled since 1971.
(Nitro College, Education Data Initiative)
According to the spending habits of college students statistics, the cost of studying has skyrocketed. In 1971, college students paid approximately $8,730 for tuition at public universities and $18,140 at private non-profit universities (both figures adjusted for inflation).
In 2021, tuition at public universities was $25,615 (an increase of 193.4%), and $53,949 at private universities (an incredible increase of 197.4%).
29. Teenagers spend 40% of their money on food and clothes.
(Statista, Reference)
Food and clothes are the top items teenagers like to spend their money on—each makes up 20% of their total spending. Accessories, personal care products, and cosmetics come in third with a 10% share.
Moreover, teenagers’ spending habits show that each teenager spends approximately $9,626 per year. In total, teenagers in the US spend $258.7 billion each year, while 62% of their income comes directly from their parents.
Conclusion
As the American economy grows, consumers’ spending habits diversify. One of the most important takeaways from this overview is that consumer staples don’t change—housing, food, transportation, and insurance. Saving or investing money while technically not spending also makes room for different services connected to personal money budgeting.
In 2020, the pandemic made people save or invest their surplus income more than ever. During that year, American spending habits changed significantly. More and more citizens became aware of their spending habits and started looking for ways to plan them more wisely.
Millennials seem to have discovered that even before the pandemic crisis. Even though they’re the highest spending population in the country, most of them plan their spending carefully and aren’t afraid to spend an extra buck on services that enable them to do so.
FAQ
What do people spend money on?
Spending habits can be divided into categories. Data shows that people in America spend the most on housing—approximately $14,994 per year is spent on rent, property maintenance, and other housing fees.
Next in line is transportation (both public and private transportation, including spending on personal vehicles), with $7,592 spent on average. It is followed by food ($5,620) and personal insurance and pension ($3,505).
How much does the average American spend per year?
An average American spends $61,334 per year or $5,111 per month. Personal spending has been steadily rising in the last five or more years. In 2015, an average American spent $55,978, which is 12.6% less. The upward trend will likely continue as the rate of income increase is also a lot higher than the rate of spending increase (currently 19% in the period from 2015 to 2019).
Who spends the most money in America?
It might sound surprising, but the richest people in America spend the least of their money. If we divide Americans according to their income, we can distinguish between the top and bottom 20% and those in between who make the average income. Data shows that the bottom 20% are most likely to spend all their income and accumulate debt, which also requires spending on interest and various fees.
What do millennials spend money on?
Millennials are the highest spending population in the US and are often said to be irresponsible and spoiled with money. However, data shows this is nothing but a myth. Millennials spend most of their money on the same expenses as everybody else—housing, food, and transportation “eat away” the majority of their income.
Still, unlike previous generations, millennials are also burdened with larger debt and less job security. Because of that, these generations are also more likely to start saving early, investing, and planning for the future, including retirement, as we’ve learned in our overview of American spending habits statistics.
Sources:
- Bureau of Economic Analysis
- PR Newswire
- CNBC
- CNBC
- CNN Money
- Deloitte
- Deloitte
- Education Data Initiative
- Experian
- FRED
- McKinsey
- McKinsey
- Money Habitudes
- National Association of Realtors
- Nitro College
- Oberlo
- Reference
- Statista
- Statista
- Statista
- Statista
- Statista
- The Fulfillment Lab
- ThinkImpact
- GAO
- BLS
- BLS
- Visual Capitalist
- Visual Capitalist


![How to Get Free Clothes From Shein? [2024 Guide]](https://savemycent.com/wp-content/uploads/2023/09/How-to-Get-Free-Clothes-From-Shein-336x220.png)